This article originally appeared at JBartlett.org.
Average per-pupil spending in New Hampshire district public schools has nearly doubled this century, as student enrollment declined sharply and reading and math assessment scores fell, a new Josiah Bartlett Center for Public Policy study finds.
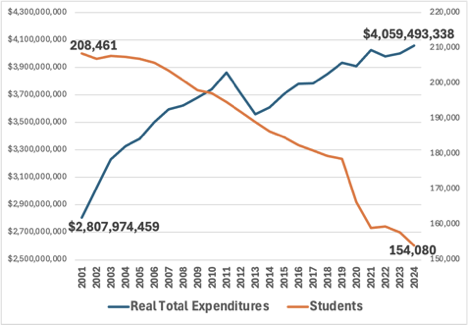
Total public school district spending in New Hampshire increased by an inflation-adjusted $1.25 billion, or 45%, from 2001 to 2024, as enrollment fell by 54,381 students, or 26%, according to state data.
The large increase in total spending, combined with a significant drop in enrollment, resulted in a nearly doubling of average per-pupil spending, the new study shows. Total per-pupil spending in district public schools rose by an inflation-adjusted 96% from
2001-2024, meaning that the average district public school student in New Hampshire had 96% more in real resources devoted to his or her education in 2024 than in 2001.
Enrollment and Real (inflation-adjusted) Total Expenditures in NH District Public Schools
2001 to 2024
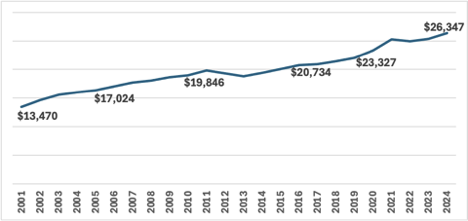
In 2001, district public schools in New Hampshire spent only $8,265 per student, but when adjusted for inflation, that figure translates to $13,470 per student in today’s dollars. Average per-pupil spending in 2024 came to $26,347, representing an increase of 96%.
This increase was so large that New Hampshire went from being 4% below the national average in per-pupil spending in 2001 to more than 20% above the national average in 2023, where 2023 was the most recent year with comparable data available.
In 2023, New Hampshire public schools spent $4,026 more per student than did public schools nationally.
Real (inflation-adjusted) Total Expenditures Per Student in NH District Public Schools
2001-2024
“Taxpayers should be asking hard questions about huge spending increases as enrollment continues to plummet,” Josiah Bartlett Center President Andrew Cline said. “These increases cannot be explained by inflation or COVID relief or state spending levels. The hard fact is that it’s impossible to reconcile a 45% increase in district public school spending this century with a 26% drop in enrollment and a large decline in reading and math performance.”
Looking at all public schools—including public charter schools and public academies—the number of students fell by 21% from 2001-2024, and yet the number of full-time-equivalent (FTE) teachers employed increased by 1%, indicating a significant reduction in average class sizes over this time.
While the number of students served fell by 21%, the number of FTE administrators employed increased by 78%, and the number of FTE “all other staff” increased by 15% between 2001 and 2024. “All other staff” includes all employees not classified by the U.S. Department of Education as either teachers or administrators.
This very large increase in staffing since 2001, coupled with the very large decrease in the number of students served, dramatically increased the number of FTE staff per 100 students in New Hampshire public schools. The number of FTE staff per 100 students in New Hampshire public schools was 13.5 in 2001, but this ratio ballooned to 18.9 by 2024. Thus, a hypothetical 500-student school in 2024 had 27.2 more FTE staff than it employed in 2001, on average—a massive increase in public school employment relative to the number of students served.
Teachers might assume that very large increases in expenditures on public schools would translate into significantly larger salaries for themselves. That did not happen. New Hampshire district public schools’ inflation-adjusted spending rose by 45% from 2001-2024, but average teacher salaries increased by only 8%, adjusted for inflation.
As total spending rose by 45% and staffing increased significantly, New Hampshire’s National Assessment of Educational Progress (NAEP) reading and math scores fell by a total of 21 points. Nationally, scores fell by 7 points, which means that New Hampshire fell behind relative to other states despite a massive increase in spending.
The declines in student achievement from 2003 to 2024 are cumulative across four NAEP exams: Grade 4 Reading, Grade 4 Mathematics, Grade 8 Reading, and Grade 8 Mathematics. A 10-point drop on a single test is approximately a full year less of learning. Thus, across these four exams, New Hampshire students in 2024 averaged about a half-year less learning in both reading and mathematics in both grades 4 and 8, relative to New Hampshire public school students in 2001. For context, U.S. Catholic schools saw a cumulative decline of only 2 points across these four exams between 2003 and 2024.
The study is an update to the Josiah Bartlett Center’s landmark 2023 report “Falling Students, Rising Spending. The center’s 2023 report analyzed data through 2019. Looking at the four years of complete data since then, we see the trends of the previous two decades continued.
In the 2020 academic year (2019-20), New Hampshire district public schools spent more than $3.3 billion on their 167,584 students. By the 2024 academic year (2023-24), New Hampshire’s district public schools were spending about $4.06 billion on only
154,080 students. New Hampshire district public schools spent almost $717 million more ($150 million after adjusting for inflation) in 2024 relative to 2020 to serve 13,504 fewer students.
On a per student basis, these expenditures increased significantly over this very short period—from $19,947 to $26,347 per student, a 32% increase. (Our study looked at fall enrollments, so the $26,347 figure is slightly higher than the state Education Department’s figure of $26,320, which is calculated based on average daily membership.)
The increase in total expenditures per student in New Hampshire district public schools (32%) was almost double the increase in the cost of living (17%), so inflation cannot explain this spending surge.
Federal revenues per New Hampshire student more than doubled between 2020 and 2024, from $965 per student to $2,179 per student (a 126% increase). Yet this increase in federal funding of $1,214 per student accounts for only 19% of the $6,400 increase in total expenditures per student over this time period.
State education spending from 2020-2024 rose by 19 percent, and local spending rose by 29%, as the cost of living rose by 17%.
As with the trend in the decades before the COVID-19 pandemic, local school district spending rose much faster than the rate of inflation despite a sharp and steady decline in enrollment. While enrollment fell by 6.3% from 2020-2024, local spending on district public schools rose by 29%.
Changes in the number of students from low-income families or with special needs also cannot explain the spending increase. The percentage of students eligible for free- or reduced-priced lunch fell by 0.9% from 2020-2024, while the percentage of students with an Individualized Education Plan (IEP) rose by just 1.7% (vs 3.35% nationally).
Following the national trend during the COVID-19 pandemic, likely due to public school shutdowns, there was a significant amount of learning loss between 2019 and 2024. Across four NAEP tests (Grades 4 and 8 reading and mathematics exams), N.H. students experienced a cumulative drop of 17 points, which was better than the national drop of 22 points. New Hampshire public school districts were required to reopen starting in late spring 2021, which was earlier than most other states.
Overall, per-pupil district public school spending increased by 32% (4% after adjusting for inflation) from 2020-2024, as enrollment fell by 6.3%. The number of total staff per 100 students rose from 18.2 to 18.9 because staff reductions (2.6%) occurred at less than half the rate of enrollment reductions (6.3%). Teacher pay increases did not keep up with inflation, falling by 4% relative to the cost of living. And reading and math scores continued to decline. The brightest spot during this period was that public schools reopened earlier than most of their counterparts around the country, limiting the learning loss in New Hampshire vs. public schools nationally.